This video is hosted on YouTube
This content is hosted by YouTube. The player loads only after you allow marketing cookies.
CRM feature
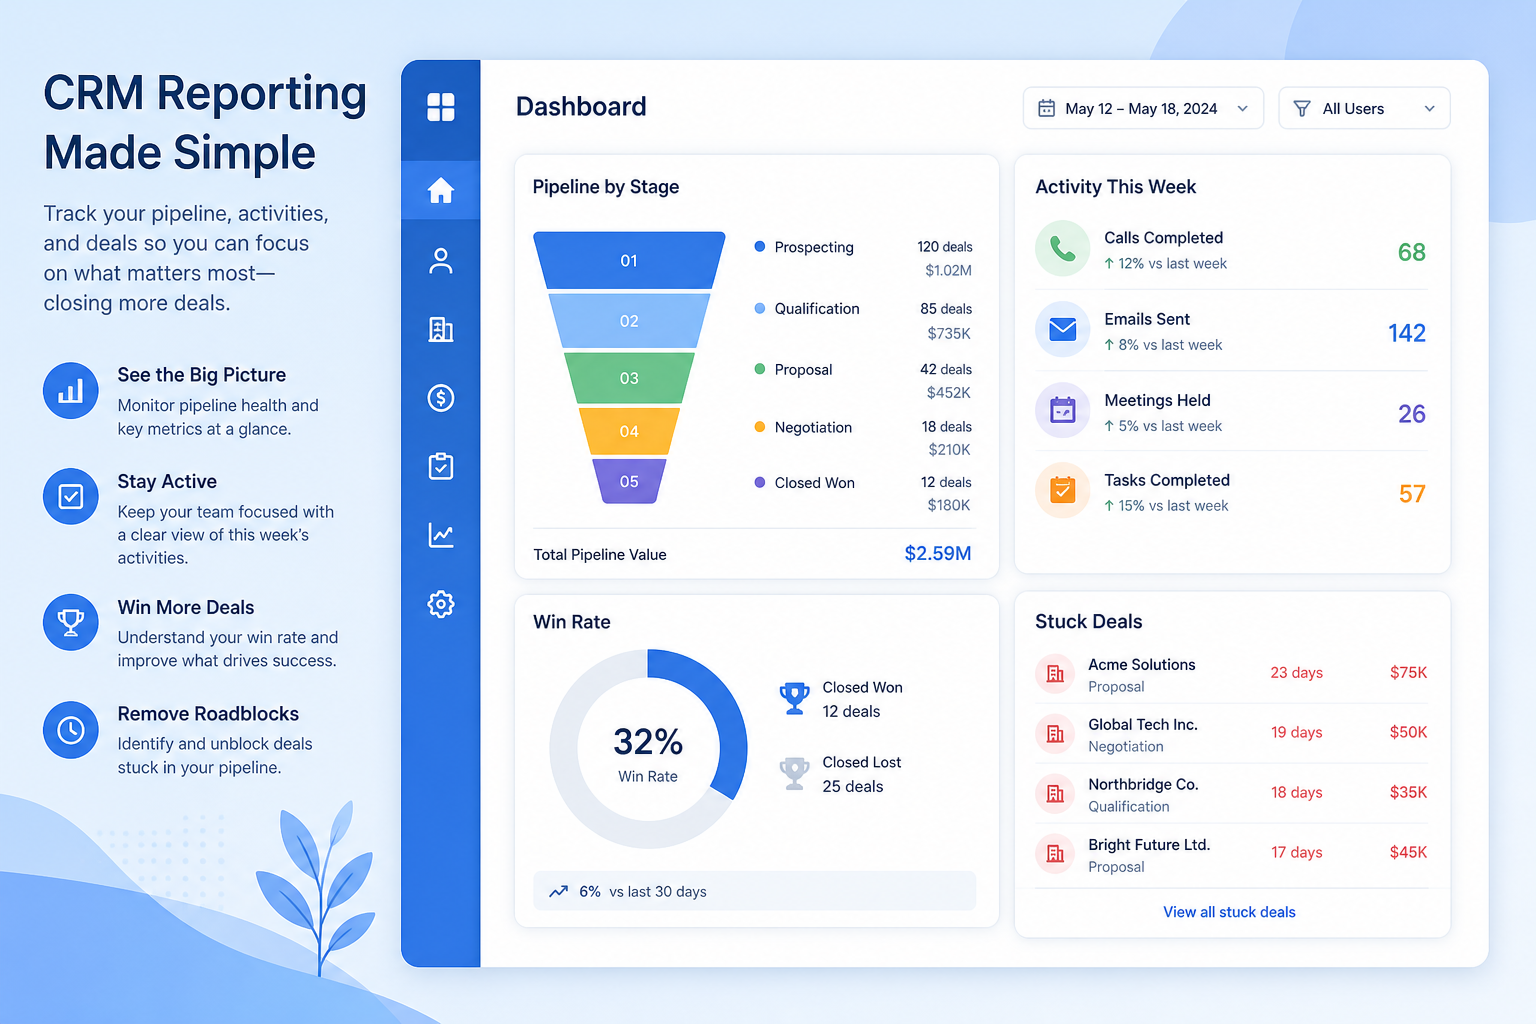
See pipeline, activity, and conversion in shared dashboards and reports — so decisions start from the same numbers, not competing screenshots.
Feature at a glance
Feature type
Reporting (plan-tiered)
Primary capability
Reporting and forecasting
Typical buyer need
Managers need trustworthy numbers without rebuilding them in a spreadsheet
Common limitation
Custom report builders and dashboard counts are usually restricted by plan
Products covered
10
Evidence records
560
Reviewed 15 Aug 2026
Fit snapshot
Reporting dashboards is the CRM feature for building charts, tables, and saved views that describe what has happened or is currently happening: pipeline by stage, activity by rep, conversion, win/loss, and SLA performance. It is descriptive analytics, not forecasting (which projects a future number). Teams use it for weekly ops reviews, coaching, and executive snapshots without exporting to a spreadsheet every time.
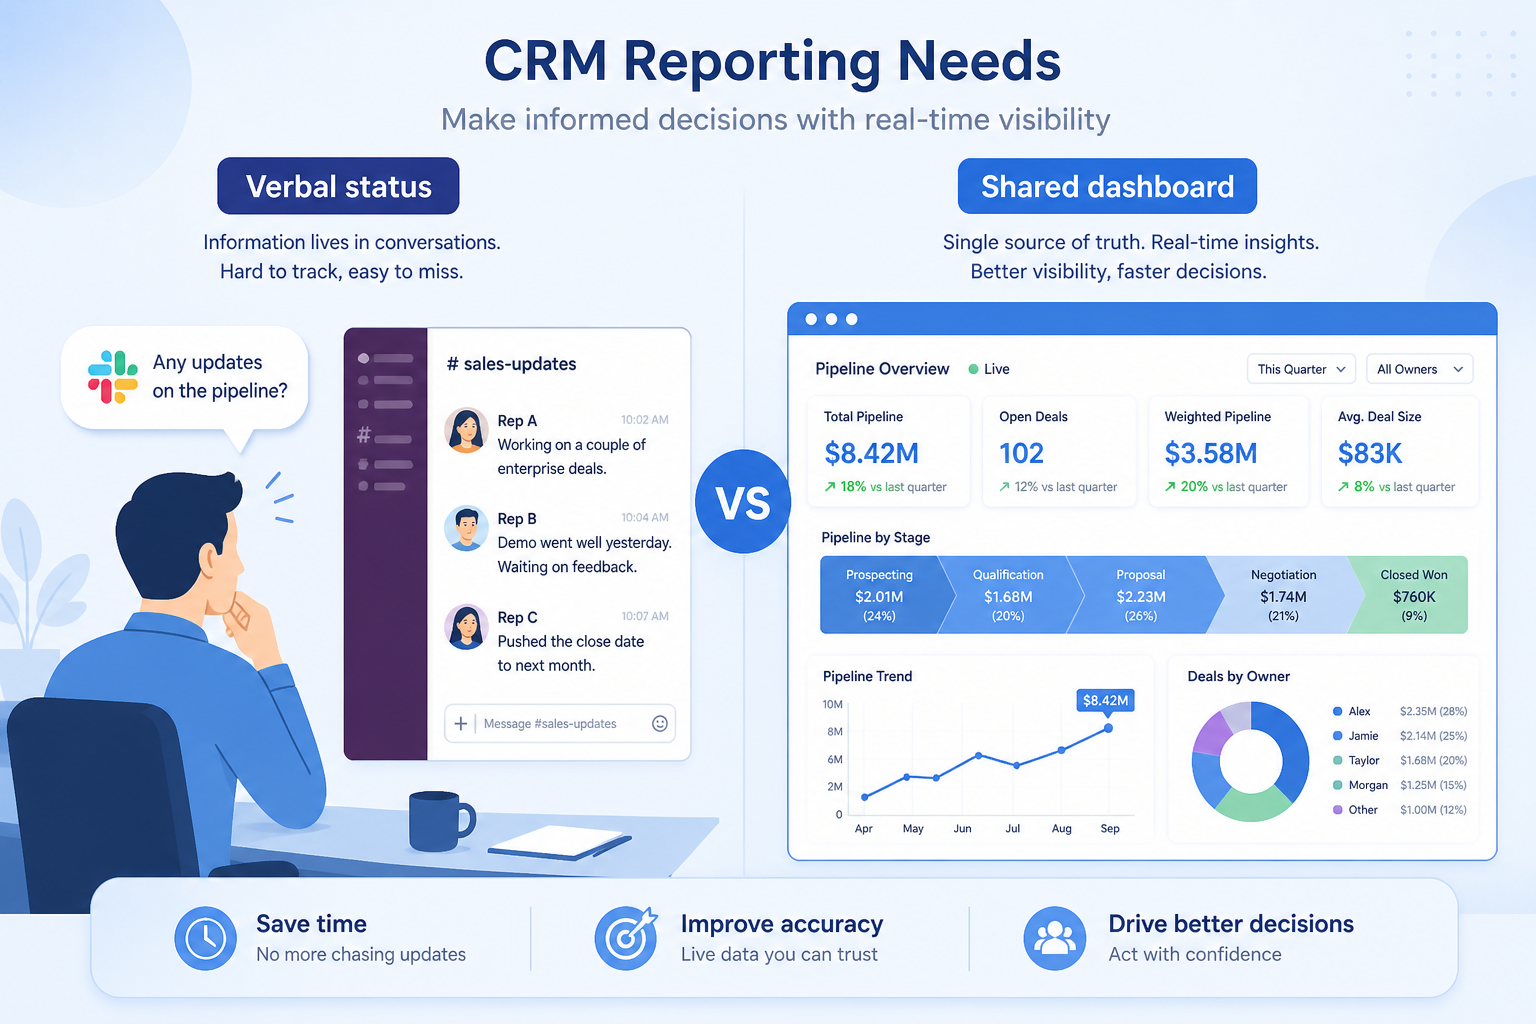
Sales managers, RevOps, founders, and team leads who currently rebuild the same charts in Sheets or BI for every meeting — and anyone who needs self-serve answers to “where are we stuck?” without filing an IT ticket.
Evaluate self-serve builders, filters, sharing, schedule/export, and whether reports use the same fields your team fills in — not how many dashboard templates ship in a gallery. A dashboard nobody opens is decoration.
Reporting dashboards are saved, shareable views of CRM data — pipeline, activity, conversion, and custom fields — so decisions rest on the system rather than a spreadsheet.
Reporting Dashboards is NOT the same as
Pressure points
Pain: Every Monday someone exports CSV and rebuilds charts that are already stale by Tuesday.
How the feature helps: Saved dashboards refresh from live CRM data and can be shared as the meeting’s single source.
Pain: Managers wait days for a simple win-rate-by-segment chart.
How the feature helps: Self-serve report builders let trained managers answer routine questions themselves.
Pain: Two dashboards show different “open pipeline” because filters disagree.
How the feature helps: Shared, named reports with documented filters become the canonical definitions.
Pain: Managers hear about effort in 1:1s instead of seeing calls, emails, and next steps on deals.
How the feature helps: Activity and pipeline dashboards make coaching evidence-based.
Results
Meetings open the same dashboard instead of debating whose export is right.
Managers self-serve common cuts without waiting on a reporting specialist.
Stage aging, missing owners, and conversion drops show up early.
Activity and outcome reports turn 1:1s into specific conversations.
How it runs
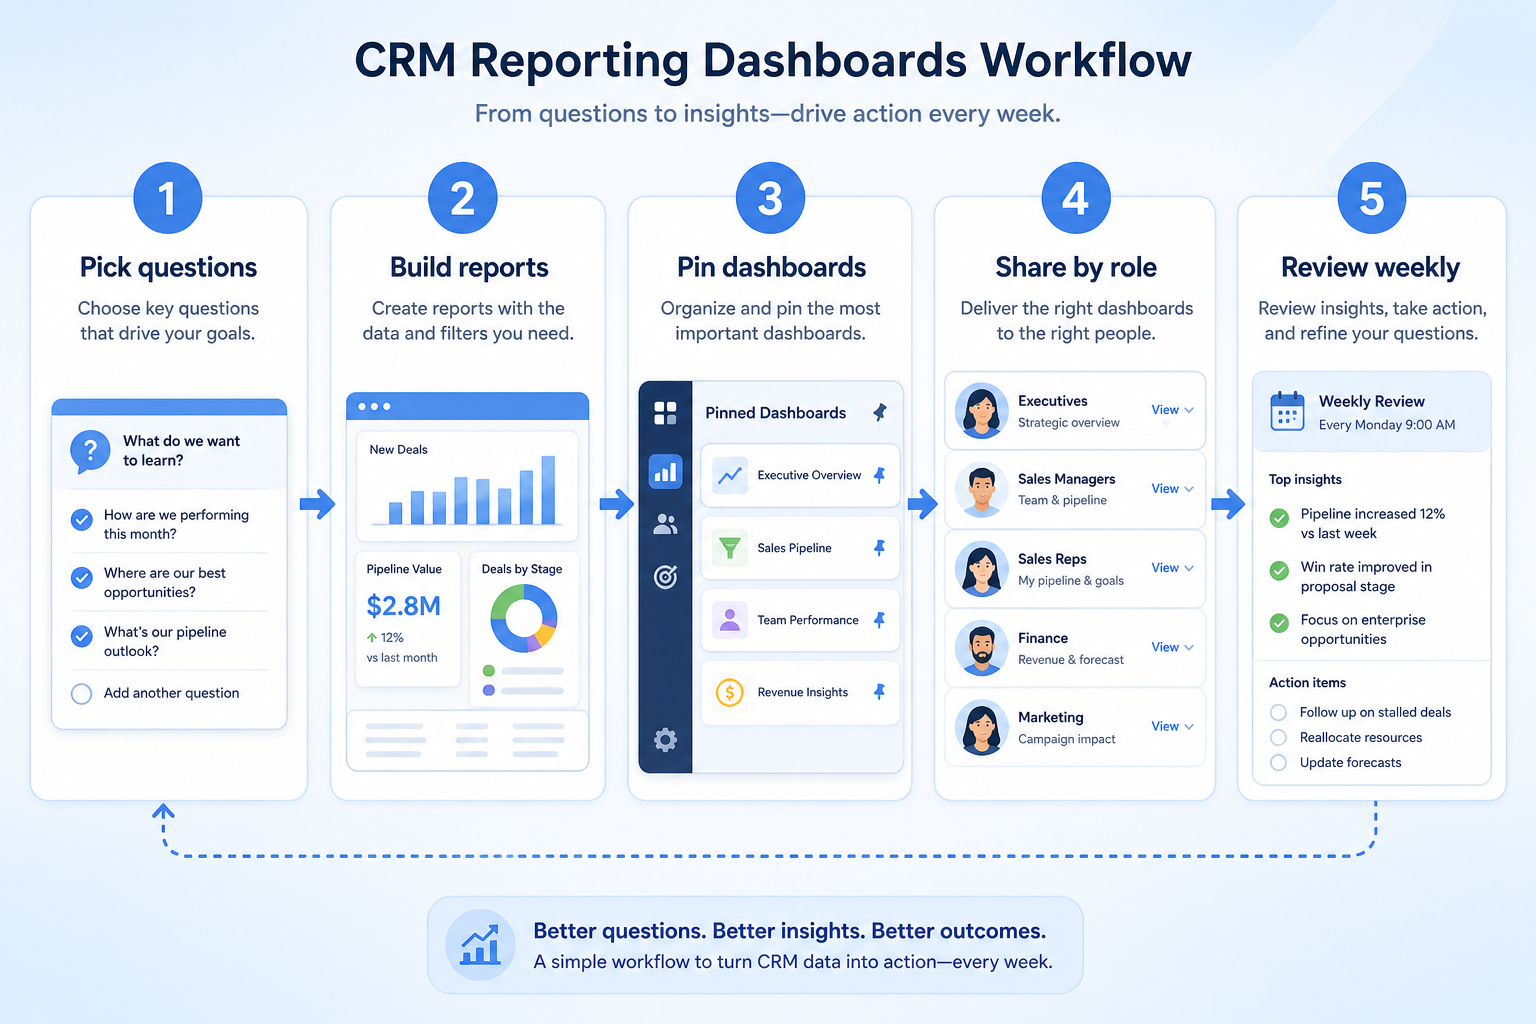
Write the recurring questions Monday reviews must answer.
Create charts/tables from CRM objects with explicit filters and owners.
Group reports for roles (AE, manager, leadership) without overcrowding.
Pin dashboards in the meeting ritual; schedule email if the product supports it.
Retire unused widgets; update filters when field definitions change.
Concrete buyer situations — not product recommendations. Use them to test whether a CRM’s implementation matches how your team works.
B2B SaaS: Monday sales ops dashboard
Situation
A RevOps analyst at a 40-person SaaS company rebuilds pipeline-by-stage and activity-by-AE charts in Sheets every Sunday night for Monday’s meeting.
What good looks like
A CRM dashboard with pipeline by stage, deals with no next step, and activity last 7 days by AE. The meeting opens that URL. Forecast stays on a separate forecasting view so descriptive and predictive conversations do not blur.
Ask vendors
Can managers build and share dashboards without admin rights? Can we filter by team hierarchy? Can reports include custom fields?
Agency: new-business conversion dashboard
Situation
An agency MD wants pitch win rate by service line, but the data is in a pitch tracker spreadsheet that diverges from CRM deals.
What good looks like
All pitches live as CRM opportunities with a Service Line custom field. A dashboard shows win rate and average cycle by service line. BD and delivery review it monthly to adjust pursuit criteria.
Ask vendors
Can dashboards group by custom fields? Can we export or schedule the dashboard? Are historical snapshots retained or only live data?
You probably need it if
You may not need it if
Capability
Reporting and forecasting
Requirement
Forecast revenue
Feature
Reporting Dashboards
Feature availability
criticalMinimum plan
highReports on custom fields
highAdvanced analytics
importantForecasting
importantDashboard or report limits
importantOfficial product demonstrations can help show how vendors implement the same feature differently. SoftwareGlimpse evaluates these alongside documentation, screenshots and other product evidence. Absence of a video does not mean a product lacks the feature.

HubSpot
The Official HubSpot Sales Hub Tutorial
This video is hosted on YouTube
This content is hosted by YouTube. The player loads only after you allow marketing cookies.
What this demonstrates
Evaluation dimensions shown
Not established by this video
Source: HubSpot · Verified 14 Aug 2026
Open source ↗
Salesforce
What is Lead Management & How Does It Work? | Salesforce Explained

This video is hosted on YouTube
This content is hosted by YouTube. The player loads only after you allow marketing cookies.
What this demonstrates
Not established by this video
Source: Salesforce · Verified 15 Aug 2026
Open source ↗
Close
Getting Started with Email in Close | How to Send and Manage Emails from Your CRM

This video is hosted on YouTube
This content is hosted by YouTube. The player loads only after you allow marketing cookies.
What this demonstrates
Not established by this video
Source: Close · Verified 15 Aug 2026
Open source ↗
Copper
How to automate Pipeline Emails

This video is hosted on YouTube
This content is hosted by YouTube. The player loads only after you allow marketing cookies.
What this demonstrates
Not established by this video
Source: Copper · Verified 15 Aug 2026
Open source ↗Not verified means insufficient evidence — not the same as unsupported.
Salesforce
Close
Copper

Creatio

Dynamics 365
HubSpot
Cells use feature support. Unknown is never treated as No. Official videos open from evidence — they are never embedded in the matrix.
| Dimension | |||||
|---|---|---|---|---|---|
| Feature availability | Supported | Supported | Supported | Supported | Supported |
| Minimum plan | Starter Suite | Solo | Basic | Growth | Sales Professional |
| Reports on custom fields | Supported | Supported | Supported | Supported | Supported |
| Advanced analytics | Not verified | Not verified | Not verified | Not verified | Not verified |
| Forecasting | ◐Plan dependent | Supported | ◐Plan dependent | Supported | ◐Plan dependent |
| Dashboard or report limits | Not verified | Not verified | Not verified | Not verified | Not verified |
Plan names come from feature entitlements — not inferred from marketing tier labels alone.
| Product | Feature starts at | Notes |
|---|---|---|
| Salesforce | Starter Suite | — |
| Close | Solo | — |
| Copper | Basic | — |
| Creatio | Growth | — |
| Dynamics 365 | Sales Professional | — |
| HubSpot | Free | — |
Two products can both support the feature while differing in depth. Official demos below are supplementary — the comparison matrix remains the structured source of truth.
HubSpot
This video is hosted on YouTube
This content is hosted by YouTube. The player loads only after you allow marketing cookies.
Official vendor tutorial
Lead management workflow — capture through assignment and follow-up
lead capture and prospecting workspace entry points
Salesforce
This video is hosted on YouTube
This content is hosted by YouTube. The player loads only after you allow marketing cookies.
Official vendor tutorial
How Salesforce explains lead management from capture through qualification.
Lead management concepts and Sales Cloud lead workflow as Salesforce presents them
Reports on custom fields
Compare how products differ on reports on custom fields rather than assuming parity.
Advanced analytics
Compare how products differ on advanced analytics rather than assuming parity.
Forecasting
Compare how products differ on forecasting rather than assuming parity.
Loading evidence explorer…
Verified product captures only — never stock imagery or mockups.
Salesforce reporting dashboards
Supported · StrongEvidence: 6 · High confidence
Available from: Starter Suite
Salesforce has researched support for reporting dashboards. See the comparison matrix for related dimensions.
Strengths
Limitations
Best for: Mid-market and enterprise sales orgs needing deep customization and reporting
See it in action
This video is hosted on YouTube
This content is hosted by YouTube. The player loads only after you allow marketing cookies.
Official vendor tutorial
How Salesforce explains lead management from capture through qualification.
Official vendor demonstration — complementary evidence, not a substitute for the comparison matrix.
View all feature evidenceClose reporting dashboards
Supported · StrongEvidence: 5 · High confidence
Available from: Solo
Close has researched support for reporting dashboards. See the comparison matrix for related dimensions.
Strengths
Limitations
Best for: Inside sales and outbound teams that live on phone/email/SMS
See it in action
This video is hosted on YouTube
This content is hosted by YouTube. The player loads only after you allow marketing cookies.
Official vendor tutorial
Official vendor demonstration — complementary evidence, not a substitute for the comparison matrix.
View all feature evidenceCopper reporting dashboards
Supported · StrongEvidence: 5 · High confidence
Available from: Basic
Copper has researched support for reporting dashboards. See the comparison matrix for related dimensions.
Strengths
Limitations
Best for: SMB teams standardized on Google Workspace
See it in action
This video is hosted on YouTube
This content is hosted by YouTube. The player loads only after you allow marketing cookies.
Official vendor tutorial
Official vendor demonstration — complementary evidence, not a substitute for the comparison matrix.
View all feature evidenceCreatio reporting dashboards
Supported · StrongEvidence: 5 · High confidence
Available from: Growth
Creatio has researched support for reporting dashboards. See the comparison matrix for related dimensions.
Strengths
Limitations
Best for: Mid-market teams needing no-code CRM + workflows
See it in action

This video is hosted on YouTube
This content is hosted by YouTube. The player loads only after you allow marketing cookies.
Official vendor tutorial
Official vendor demonstration — complementary evidence, not a substitute for the comparison matrix.
View all feature evidenceDynamics 365 reporting dashboards
Supported · StrongEvidence: 5 · High confidence
Available from: Sales Professional
Reporting/dashboards; Power BI advanced analytics noted.
Strengths
Limitations
Best for: Mid-market and enterprise teams standardized on Microsoft 365
See it in action

This video is hosted on YouTube
This content is hosted by YouTube. The player loads only after you allow marketing cookies.
Official vendor tutorial
Official vendor demonstration — complementary evidence, not a substitute for the comparison matrix.
View all feature evidencePrebuilt reports vs custom builders
Prebuilt reports are immediately useful; builders are more capable and take time to learn.
In-CRM reporting vs BI tooling
Native reporting is convenient; a warehouse handles cross-system analysis better.
Plan restrictions
Availability and depth often differ by plan tier, so check where this feature starts.
Feature availability alone does not tell you whether the implementation fits your workflow. Compare depth, plan gating, and related dimensions before shortlisting.
Relationship-led teams
SituationalSurface accounts with no recent contact.
Pipeline-led sales teams
Medium relevanceReport on stage movement, not just current totals.
High-volume lead handling
SituationalReport on response time and conversion by source.
Growing teams
Medium relevanceAnswer what is open and what closed, without a spreadsheet.
Add this as a requirement in your CRM shortlist and personalize for team size, budget, and other priorities.
Find My CRM10
Products covered
560
Evidence items
277
Screenshots
37
Plan records
Capability
Reporting and forecasting
Requirement
Forecast revenue
Feature
Reporting Dashboards
Products
10 researched
Evidence
560 records
They are saved charts and tables built from CRM data to describe current or historical pipeline, activity, and outcomes in a shareable view.
Dashboards and reports describe what is or was. Forecasting projects what may close. Keep the two jobs separate in meetings even when both live in the CRM.
Often not at first. BI becomes useful when you must join CRM data to finance, product, or long history the CRM does not retain well.
Compare catalogue CRM products based on this feature plus your other requirements, team size and budget.
Explore the official documentation, screenshots and product demonstrations used to understand how each CRM implements this feature.
41 items
Official video · Attio
Supports
Demonstrates

This video is hosted on YouTube
This content is hosted by YouTube. The player loads only after you allow marketing cookies.
Official vendor tutorial
Verified: 15 Aug 2026
Open source ↗Official video · Bitrix24
Supports
Demonstrates

This video is hosted on YouTube
This content is hosted by YouTube. The player loads only after you allow marketing cookies.
Official vendor tutorial
Verified: 15 Aug 2026
Open source ↗Official video · HubSpot
Supports
Demonstrates
This video is hosted on YouTube
This content is hosted by YouTube. The player loads only after you allow marketing cookies.
Official vendor tutorial
Lead management workflow — capture through assignment and follow-up
Verified: 14 Aug 2026
Open source ↗
Official video · Pipedrive
Supports
Demonstrates
This video is hosted on YouTube
This content is hosted by YouTube. The player loads only after you allow marketing cookies.
Official vendor tutorial
How Pipedrive Leads Inbox qualifies inbound leads before creating deals.
Verified: 15 Aug 2026
Open source ↗Official video · Salesforce
Supports
Demonstrates
This video is hosted on YouTube
This content is hosted by YouTube. The player loads only after you allow marketing cookies.
Official vendor tutorial
How Salesforce explains lead management from capture through qualification.
Verified: 15 Aug 2026
Open source ↗Official video · Zoho
Supports
Demonstrates

This video is hosted on YouTube
This content is hosted by YouTube. The player loads only after you allow marketing cookies.
Official vendor tutorial
How Zoho CRM manages leads from capture through conversion.
Verified: 15 Aug 2026
Open source ↗Screenshot · Attio
Supports
Demonstrates
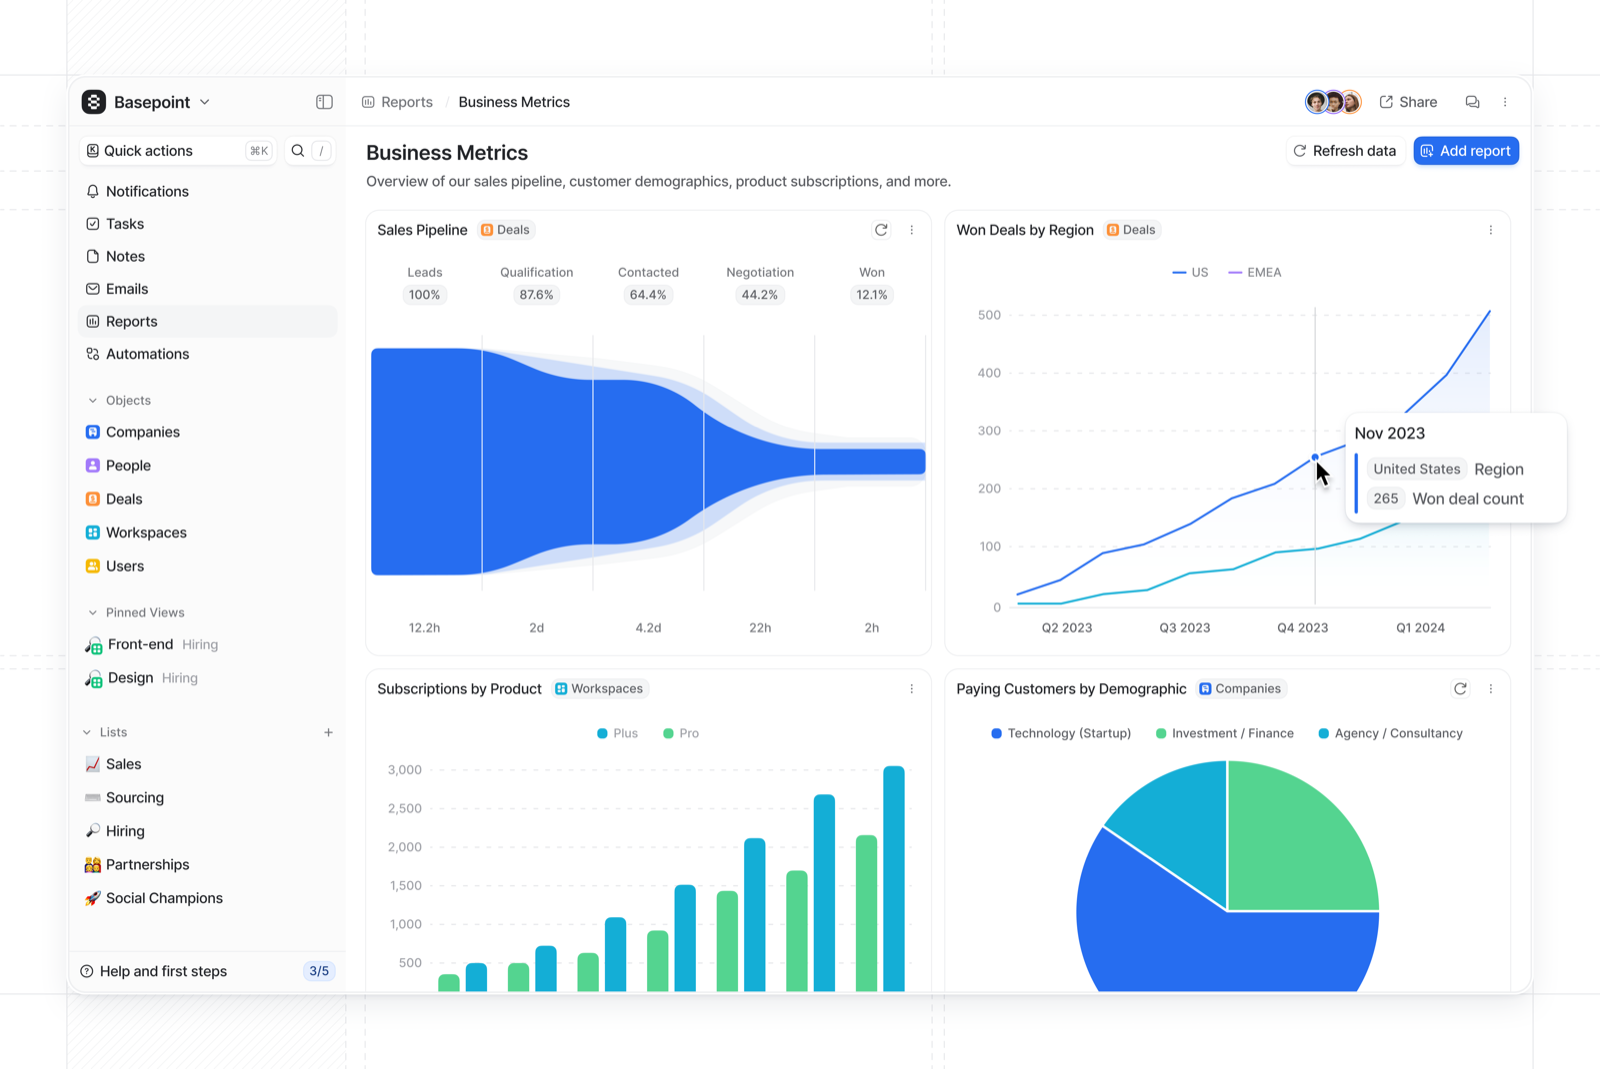
Verified: 15 Aug 2026
Open source ↗Screenshot · Attio
Supports
Demonstrates
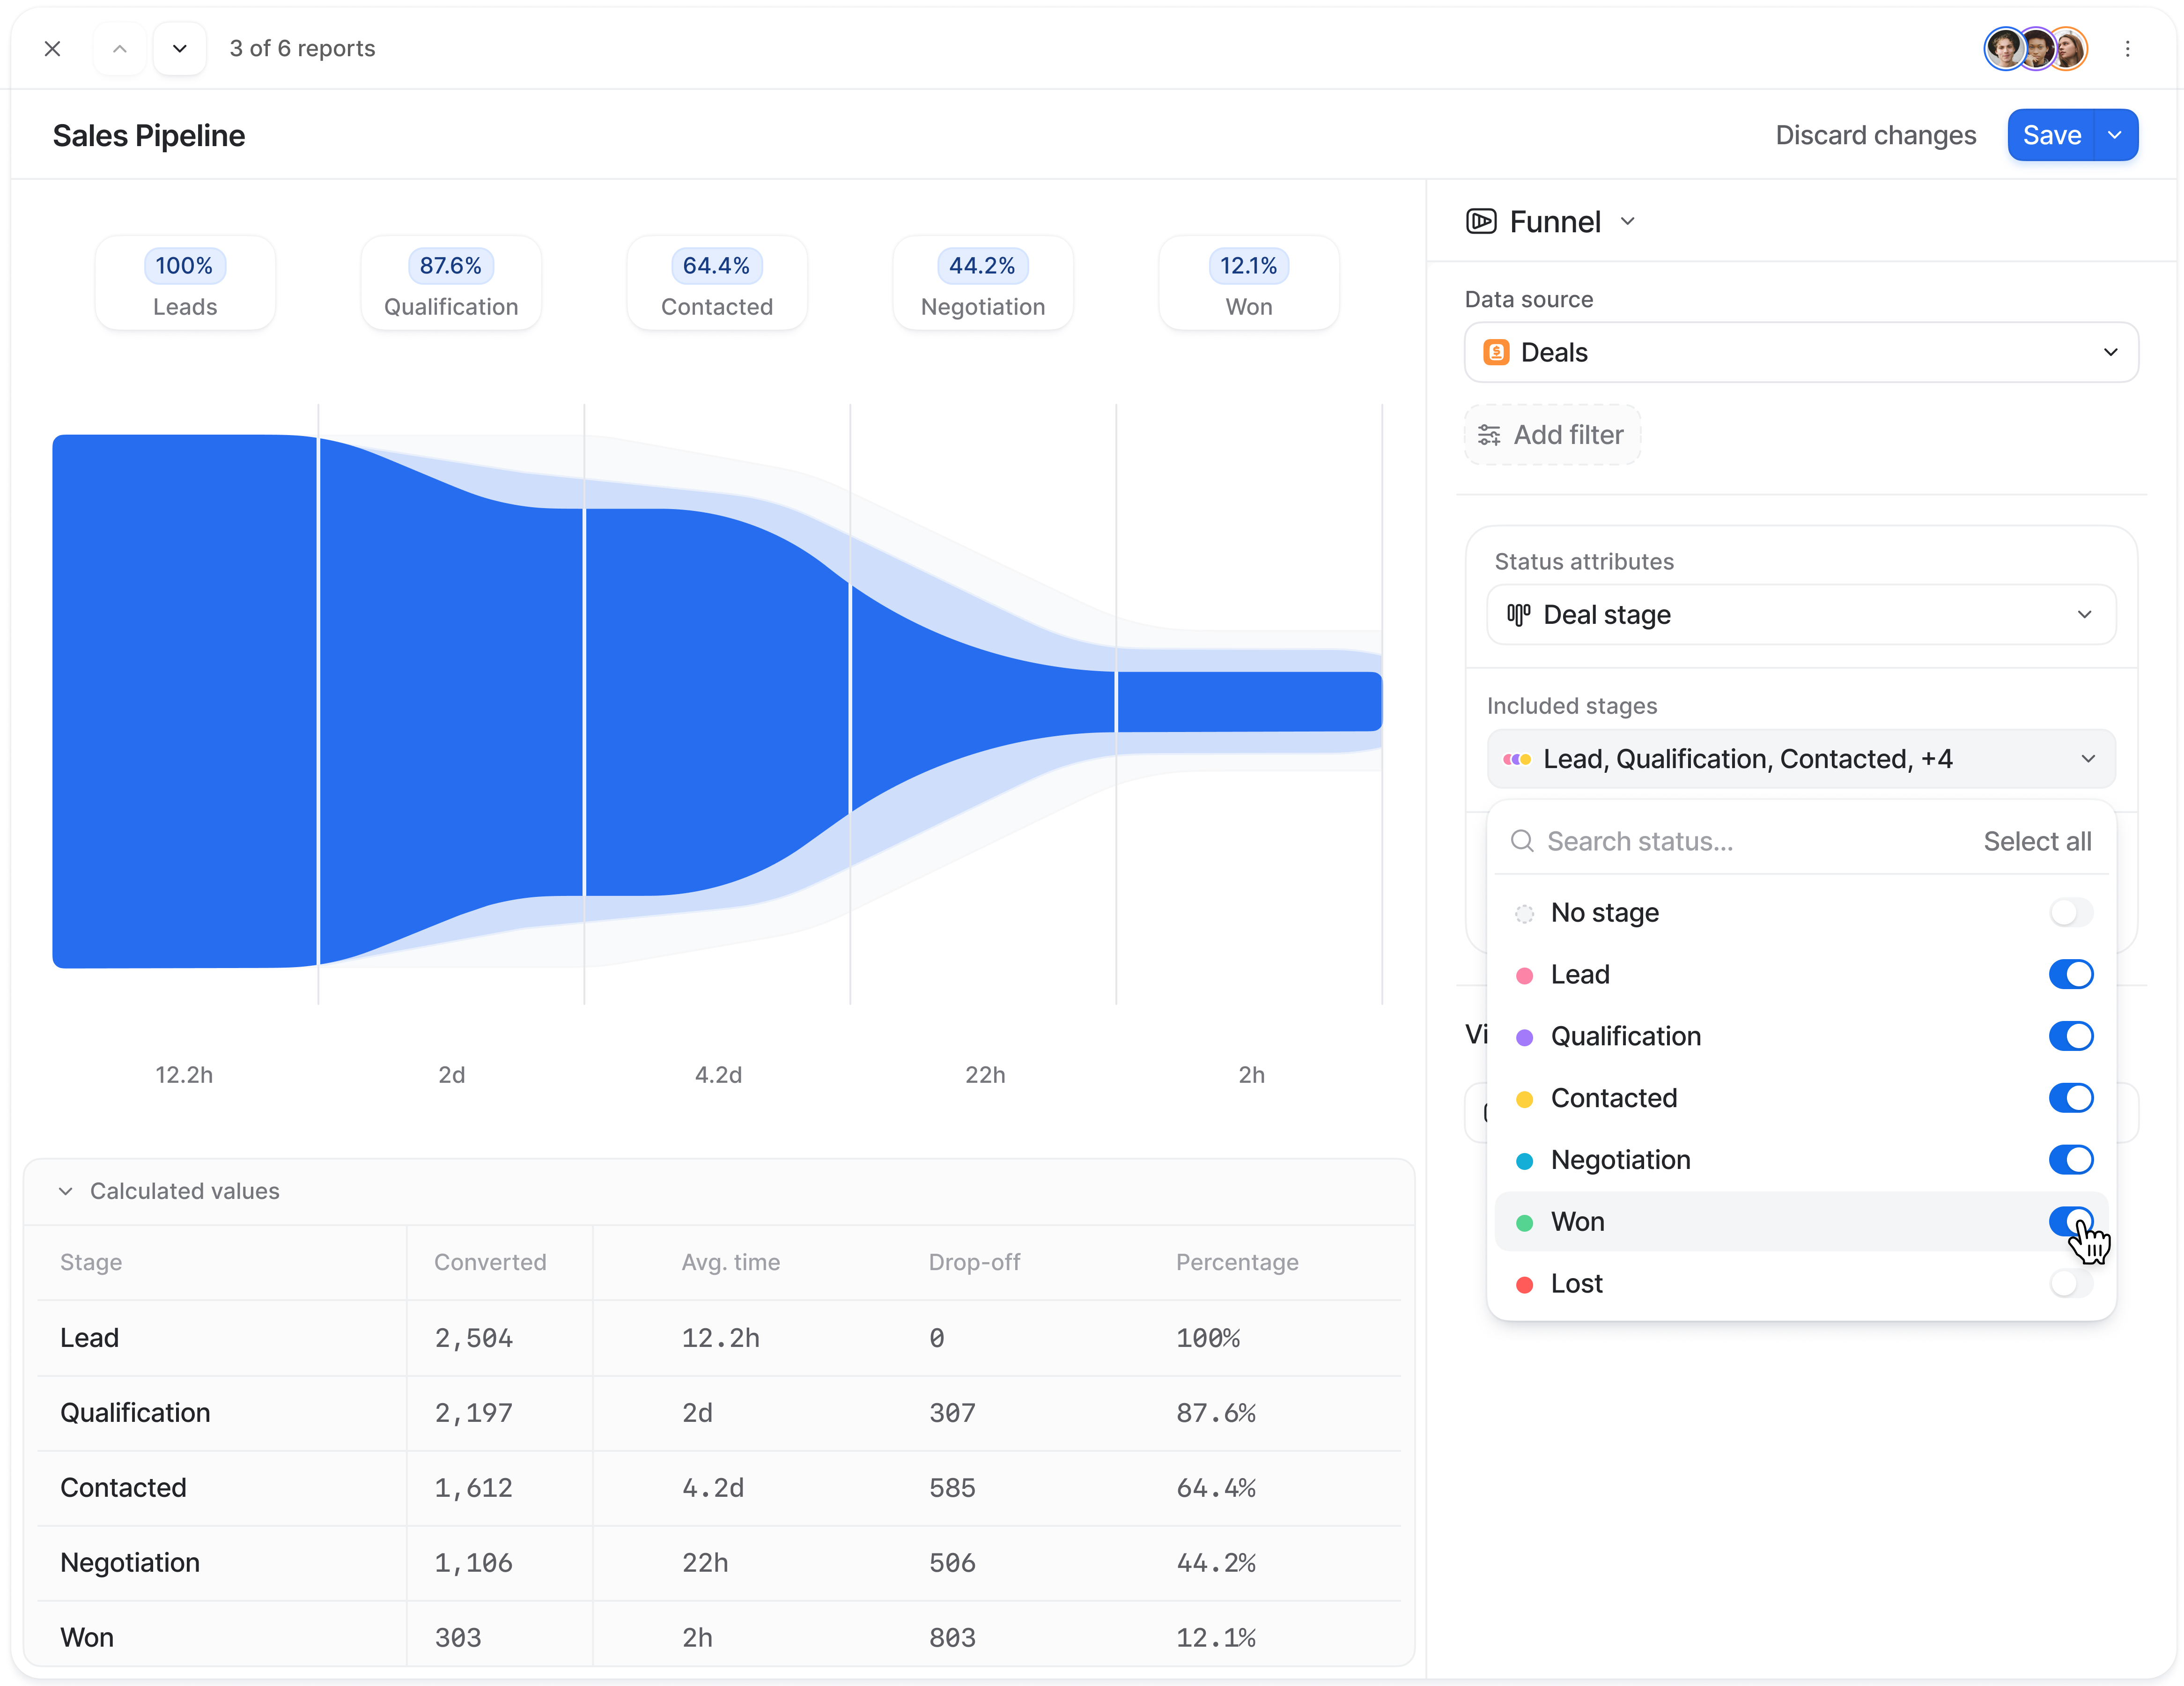
Verified: 15 Aug 2026
Open source ↗Screenshot · Attio
Supports
Demonstrates
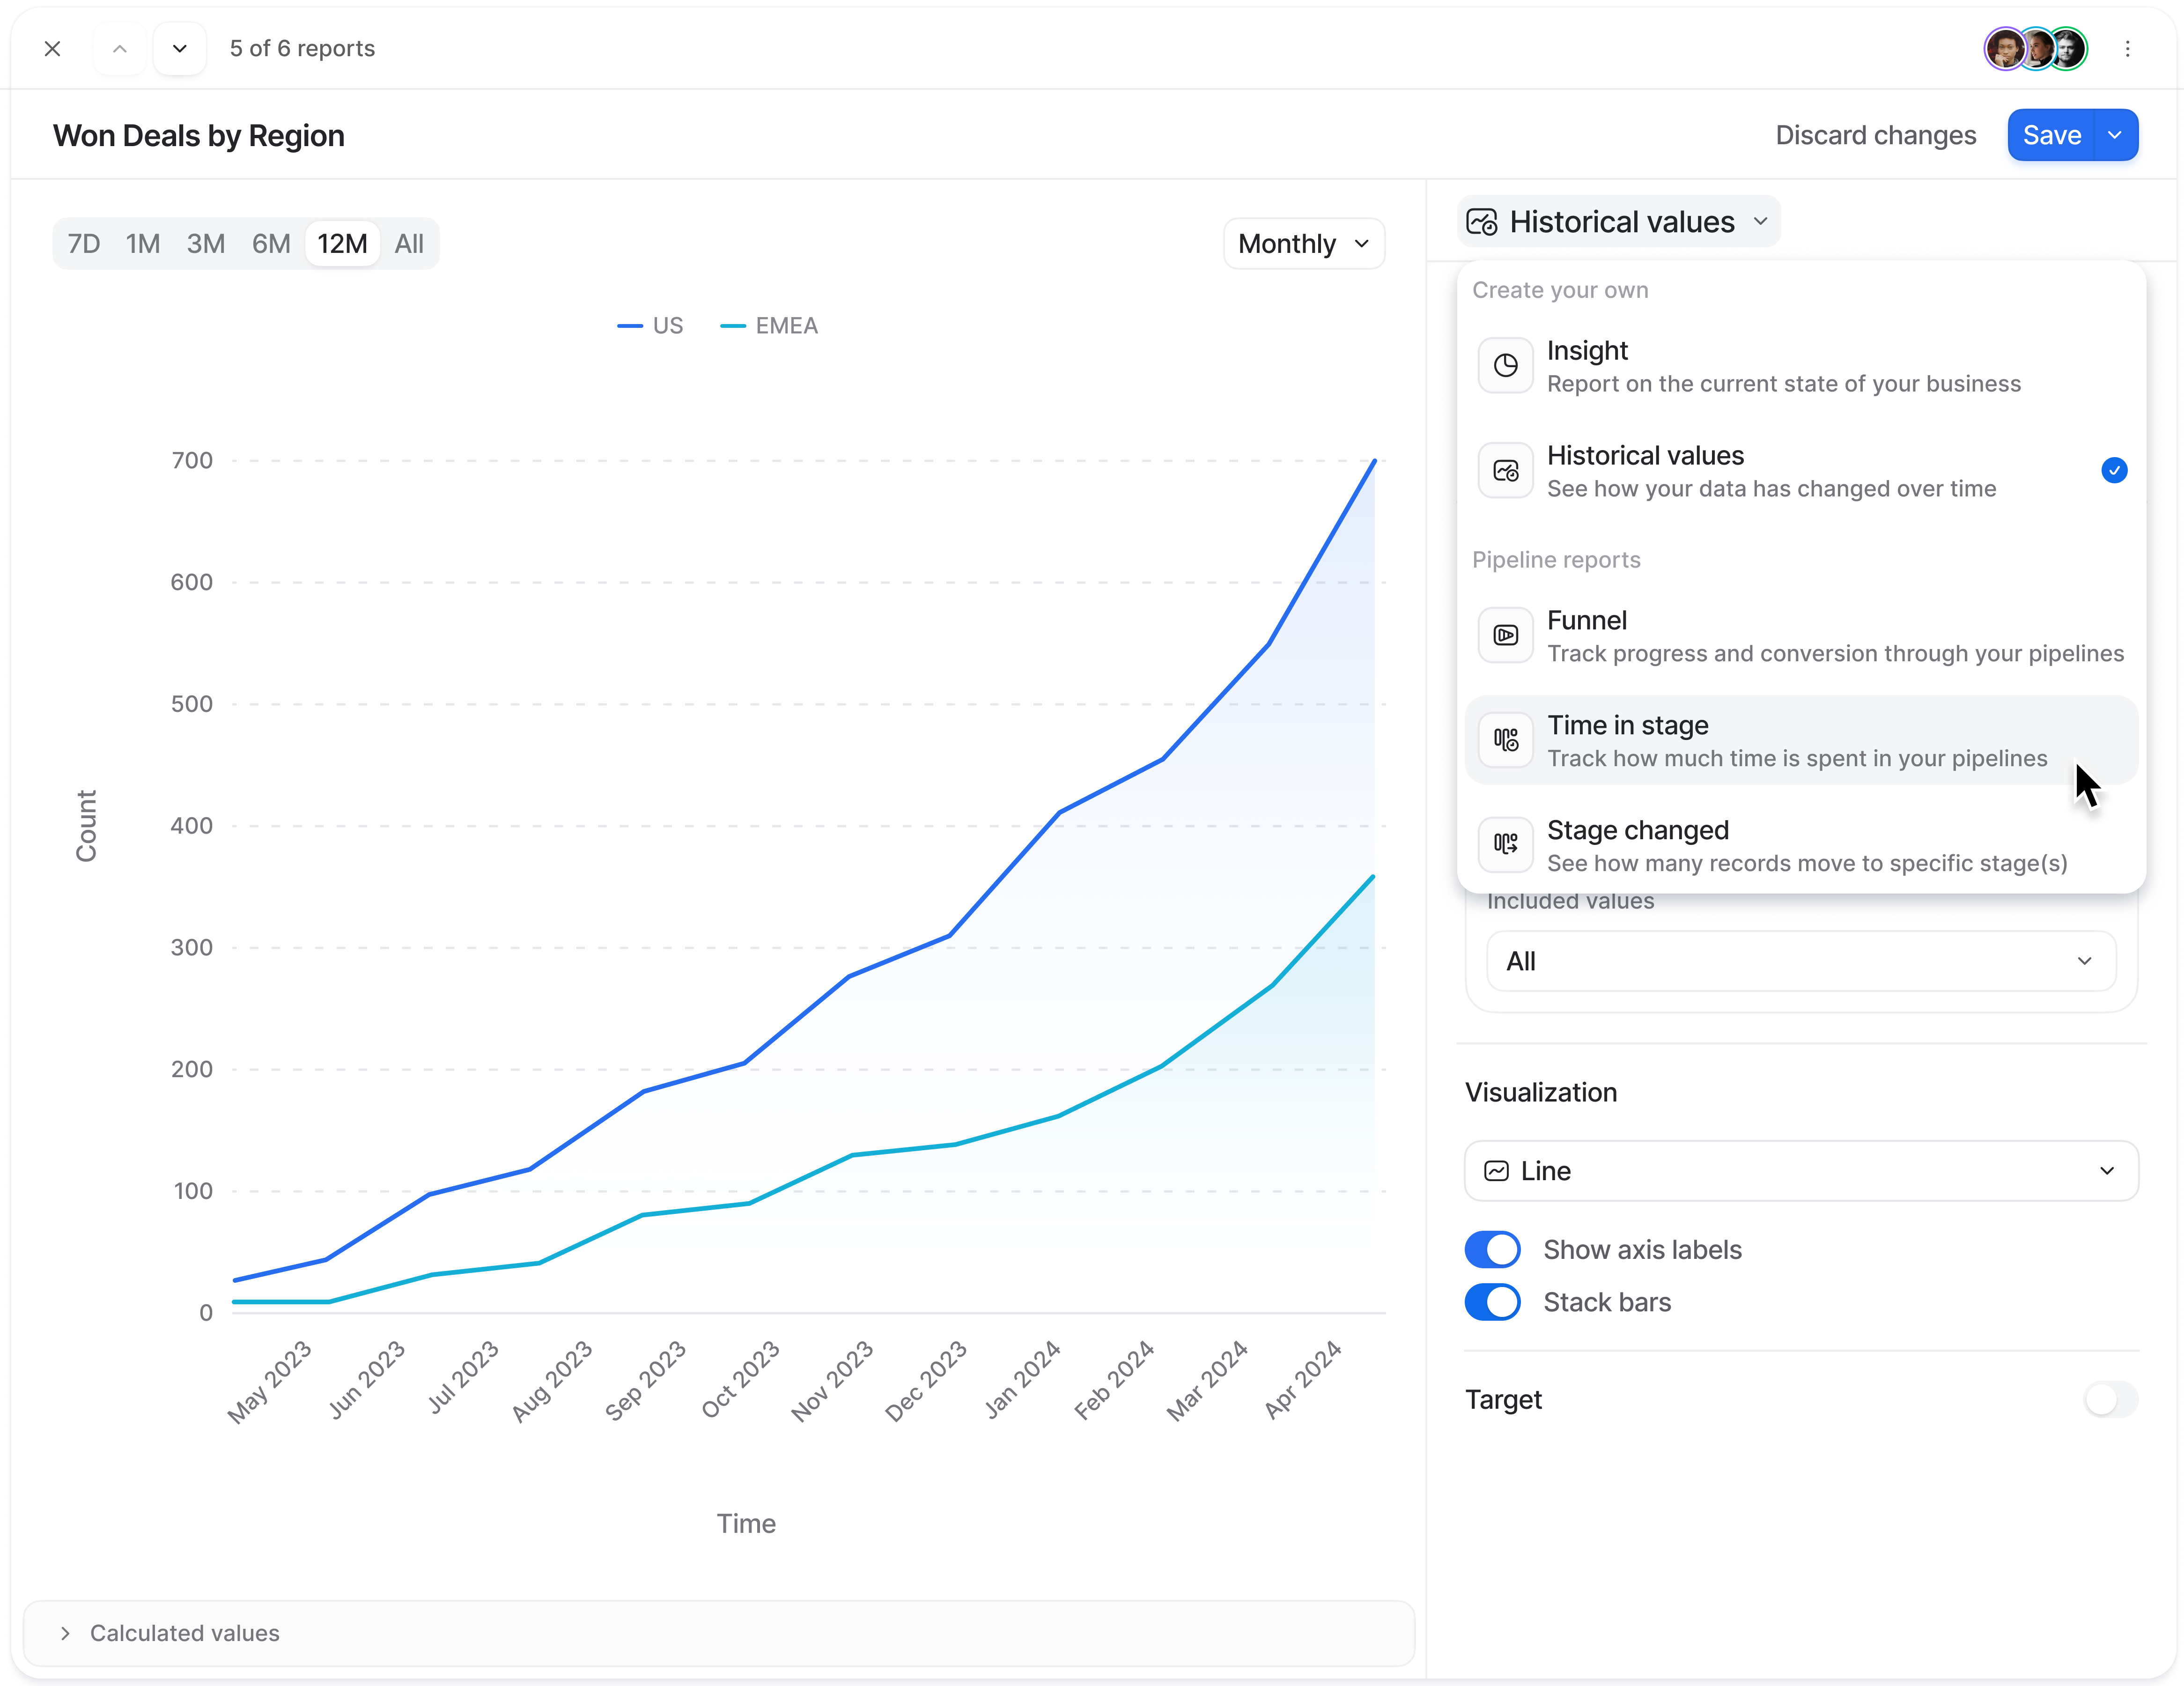
Verified: 15 Aug 2026
Open source ↗Screenshot · Close
Supports
Demonstrates
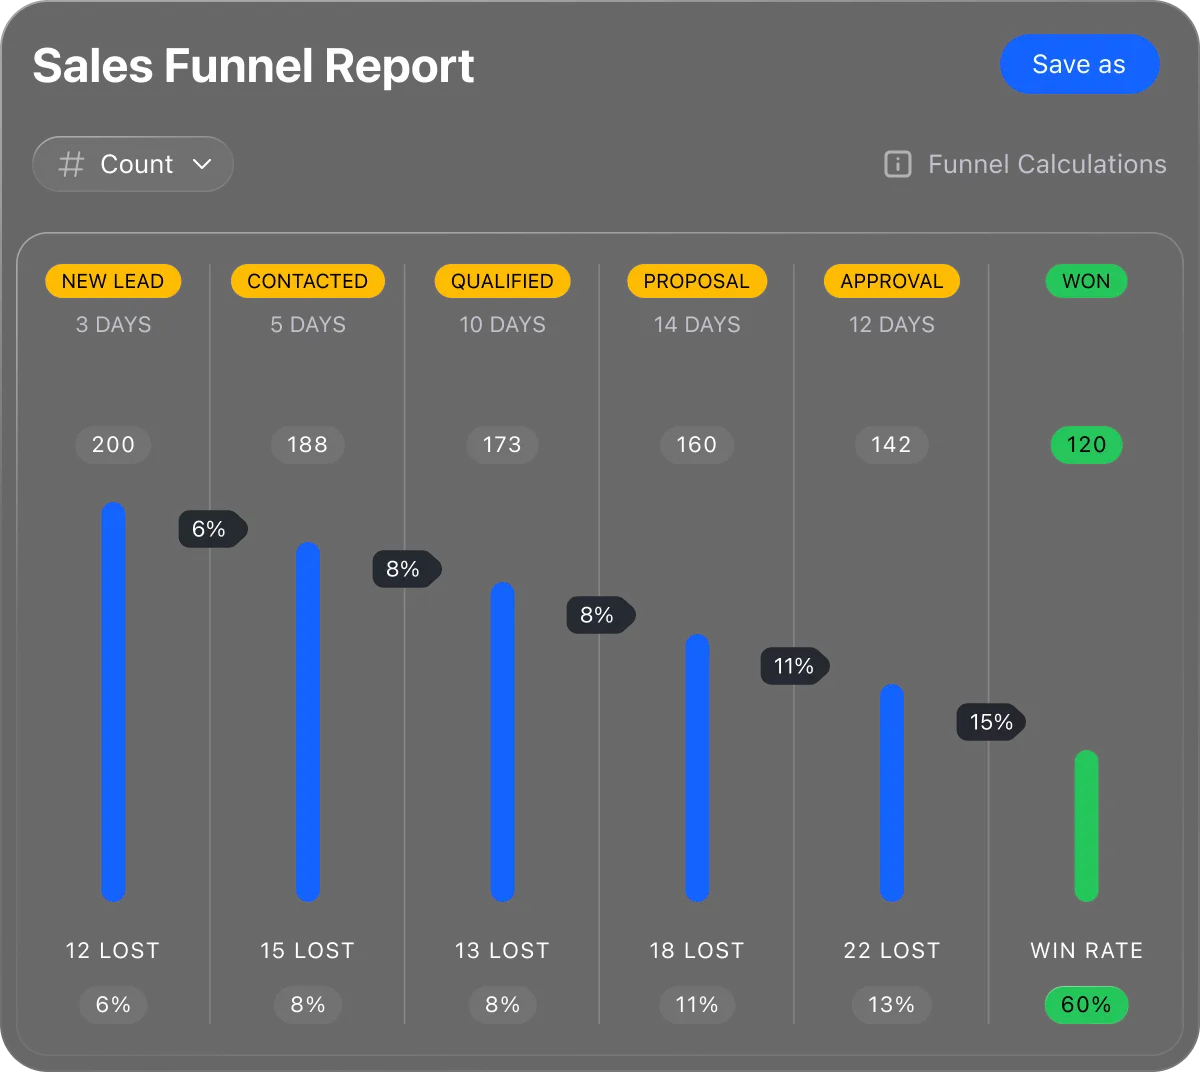
Verified: 13 Aug 2026
Open source ↗Screenshot · Close
Supports
Demonstrates
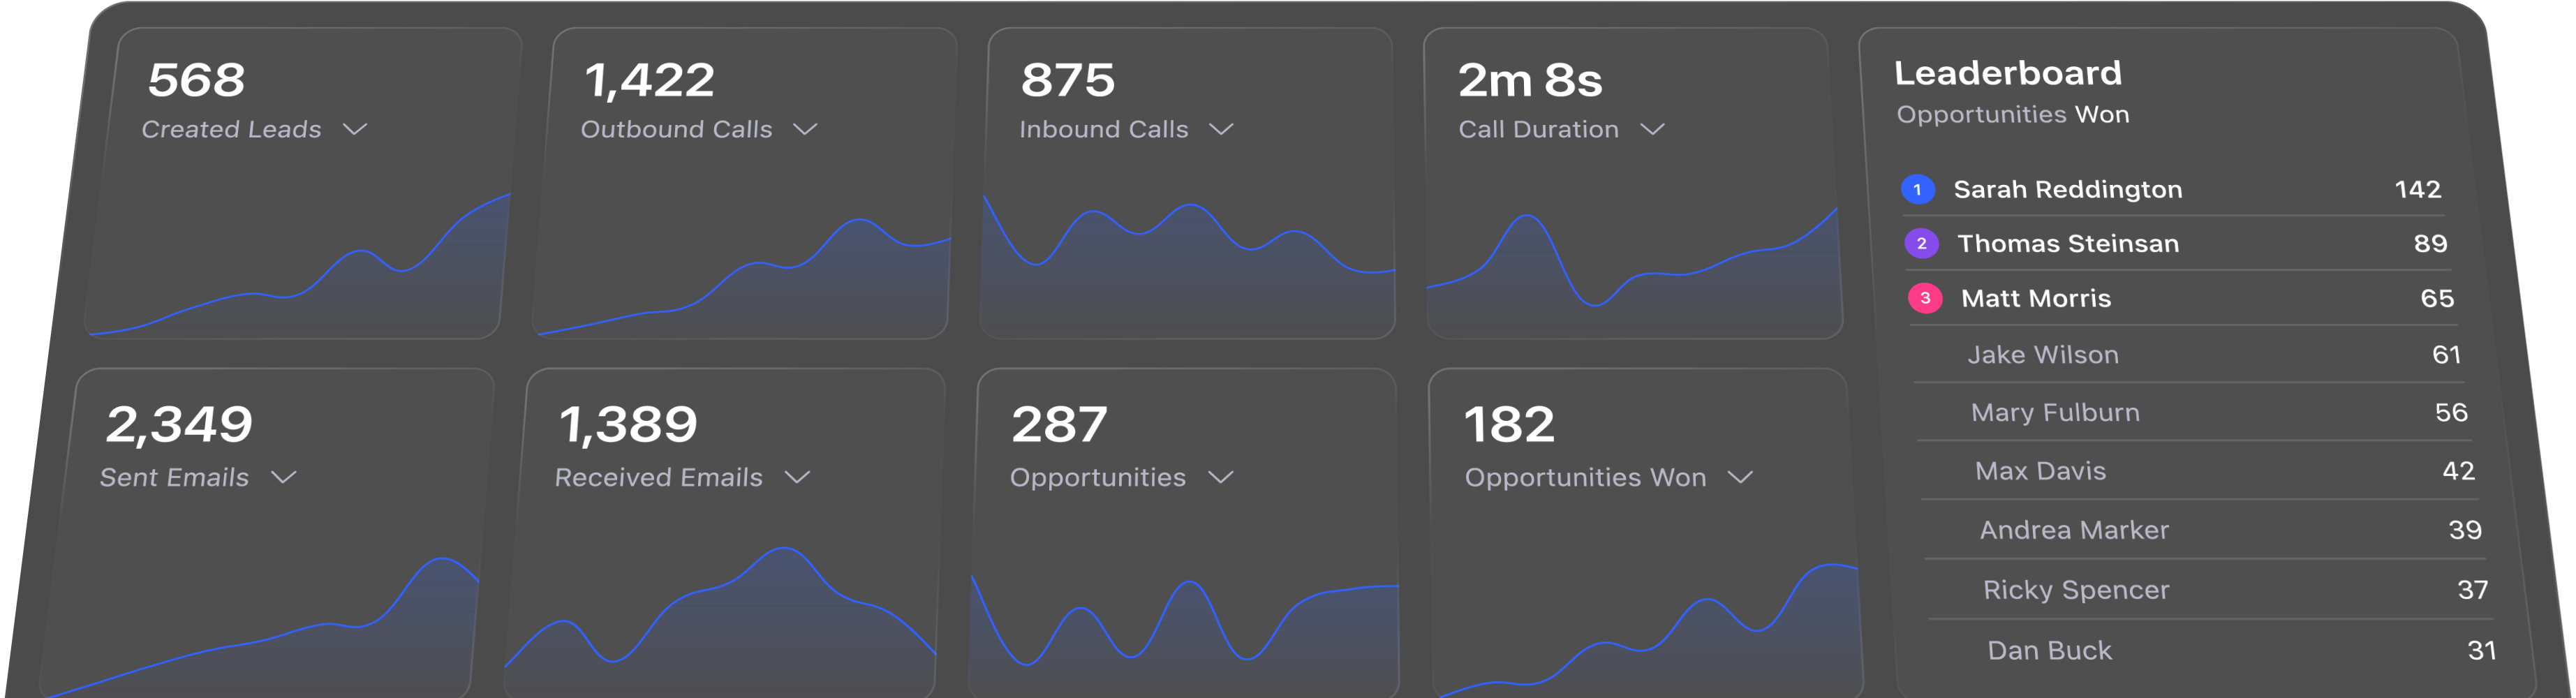
Verified: 13 Aug 2026
Open source ↗Screenshot · Dynamics 365
Supports
Demonstrates

Verified: 14 Aug 2026
Open source ↗Screenshot · HubSpot
Supports
Demonstrates
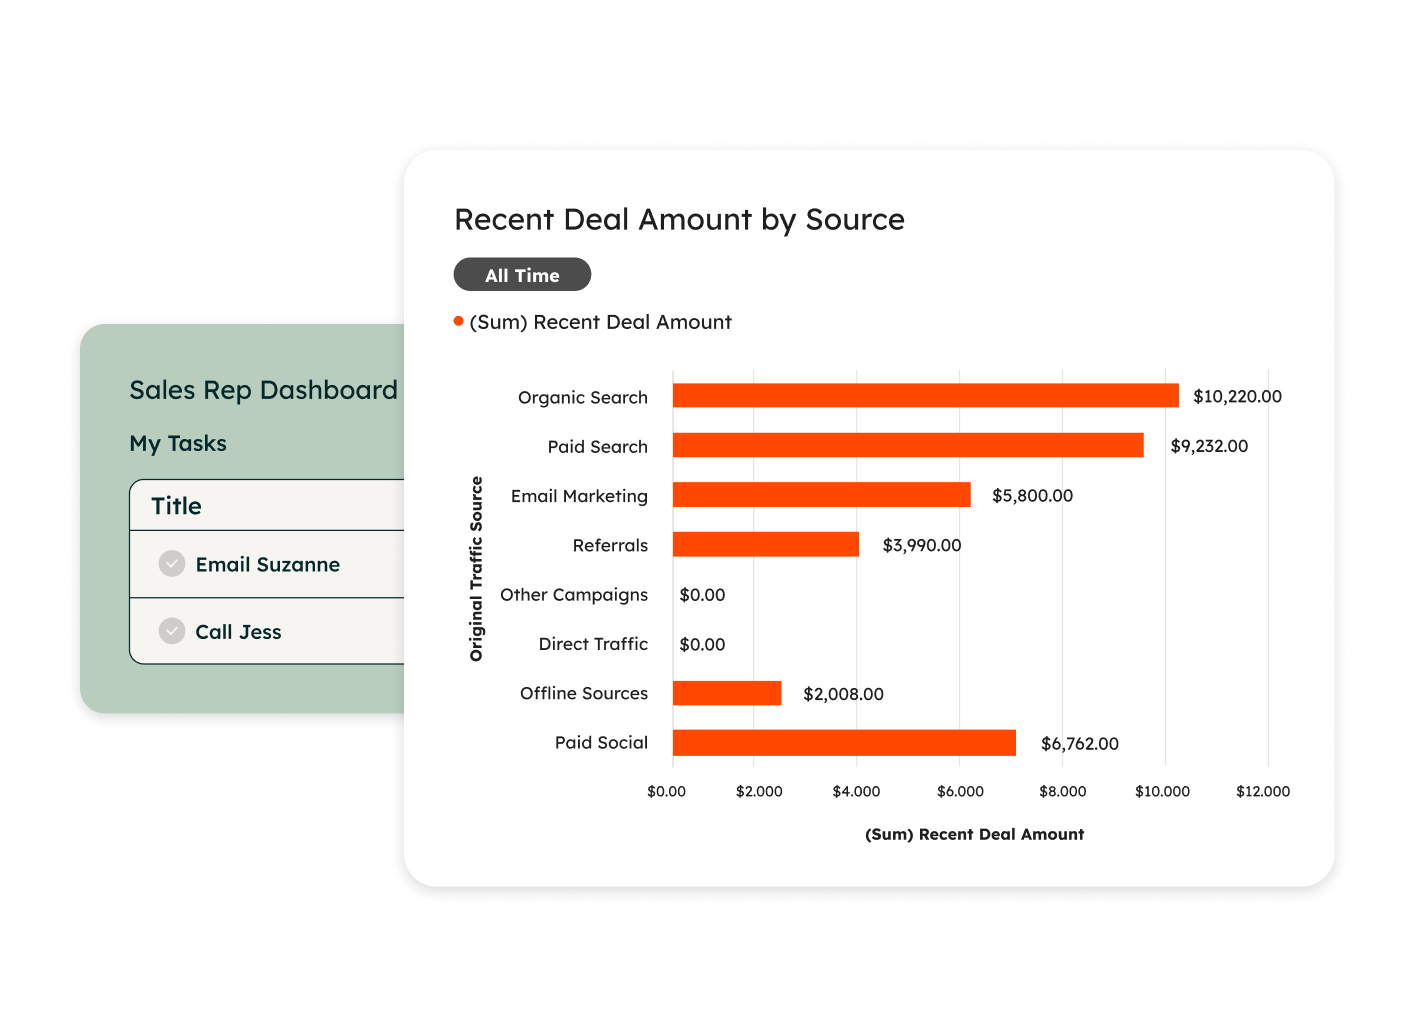
Verified: 14 Aug 2026
Open source ↗Screenshot · Keap
Supports
Demonstrates
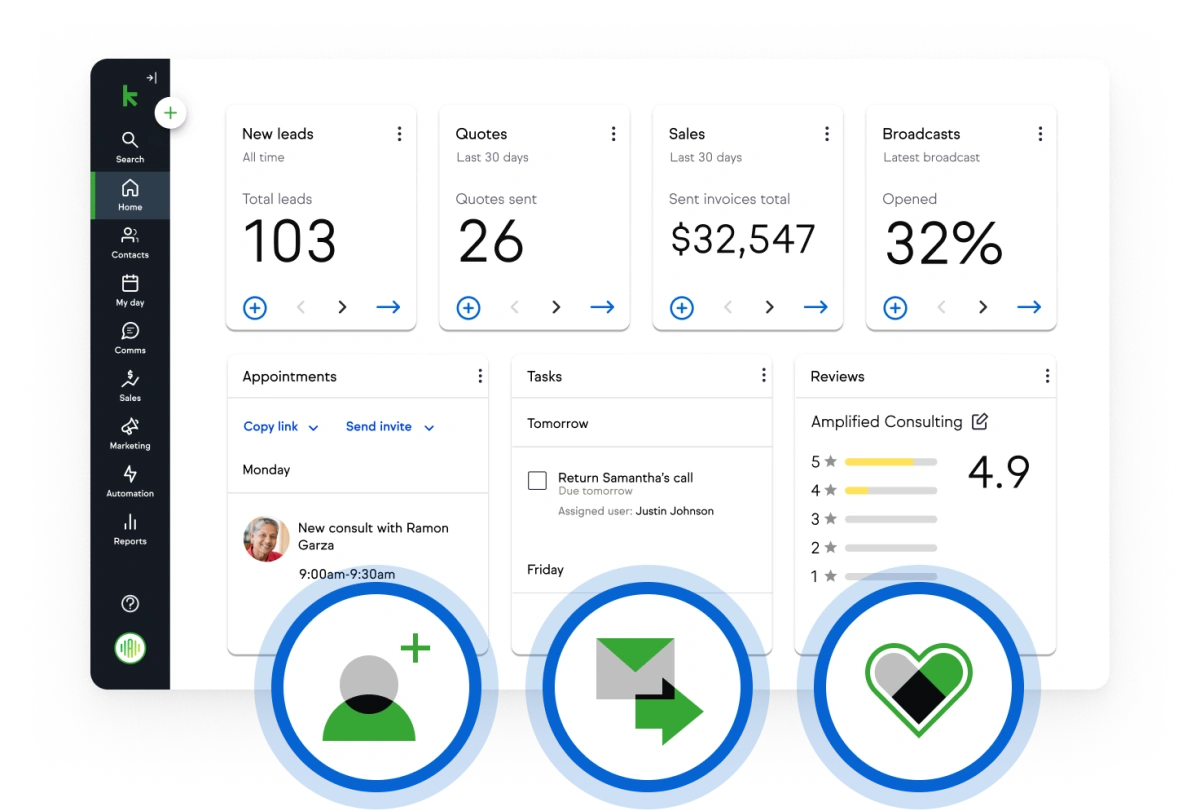
Verified: 13 Aug 2026
Open source ↗Screenshot · Keap
Supports
Demonstrates

Verified: 13 Aug 2026
Open source ↗Screenshot · Mailchimp
Supports
Demonstrates

Verified: 17 Aug 2026
Open source ↗Screenshot · Pipedrive
Supports
Demonstrates
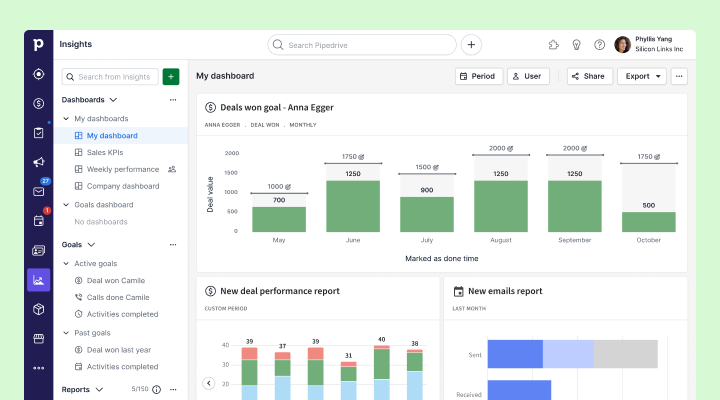
Verified: 13 Aug 2026
Open source ↗Screenshot · Salesforce
Supports
Demonstrates
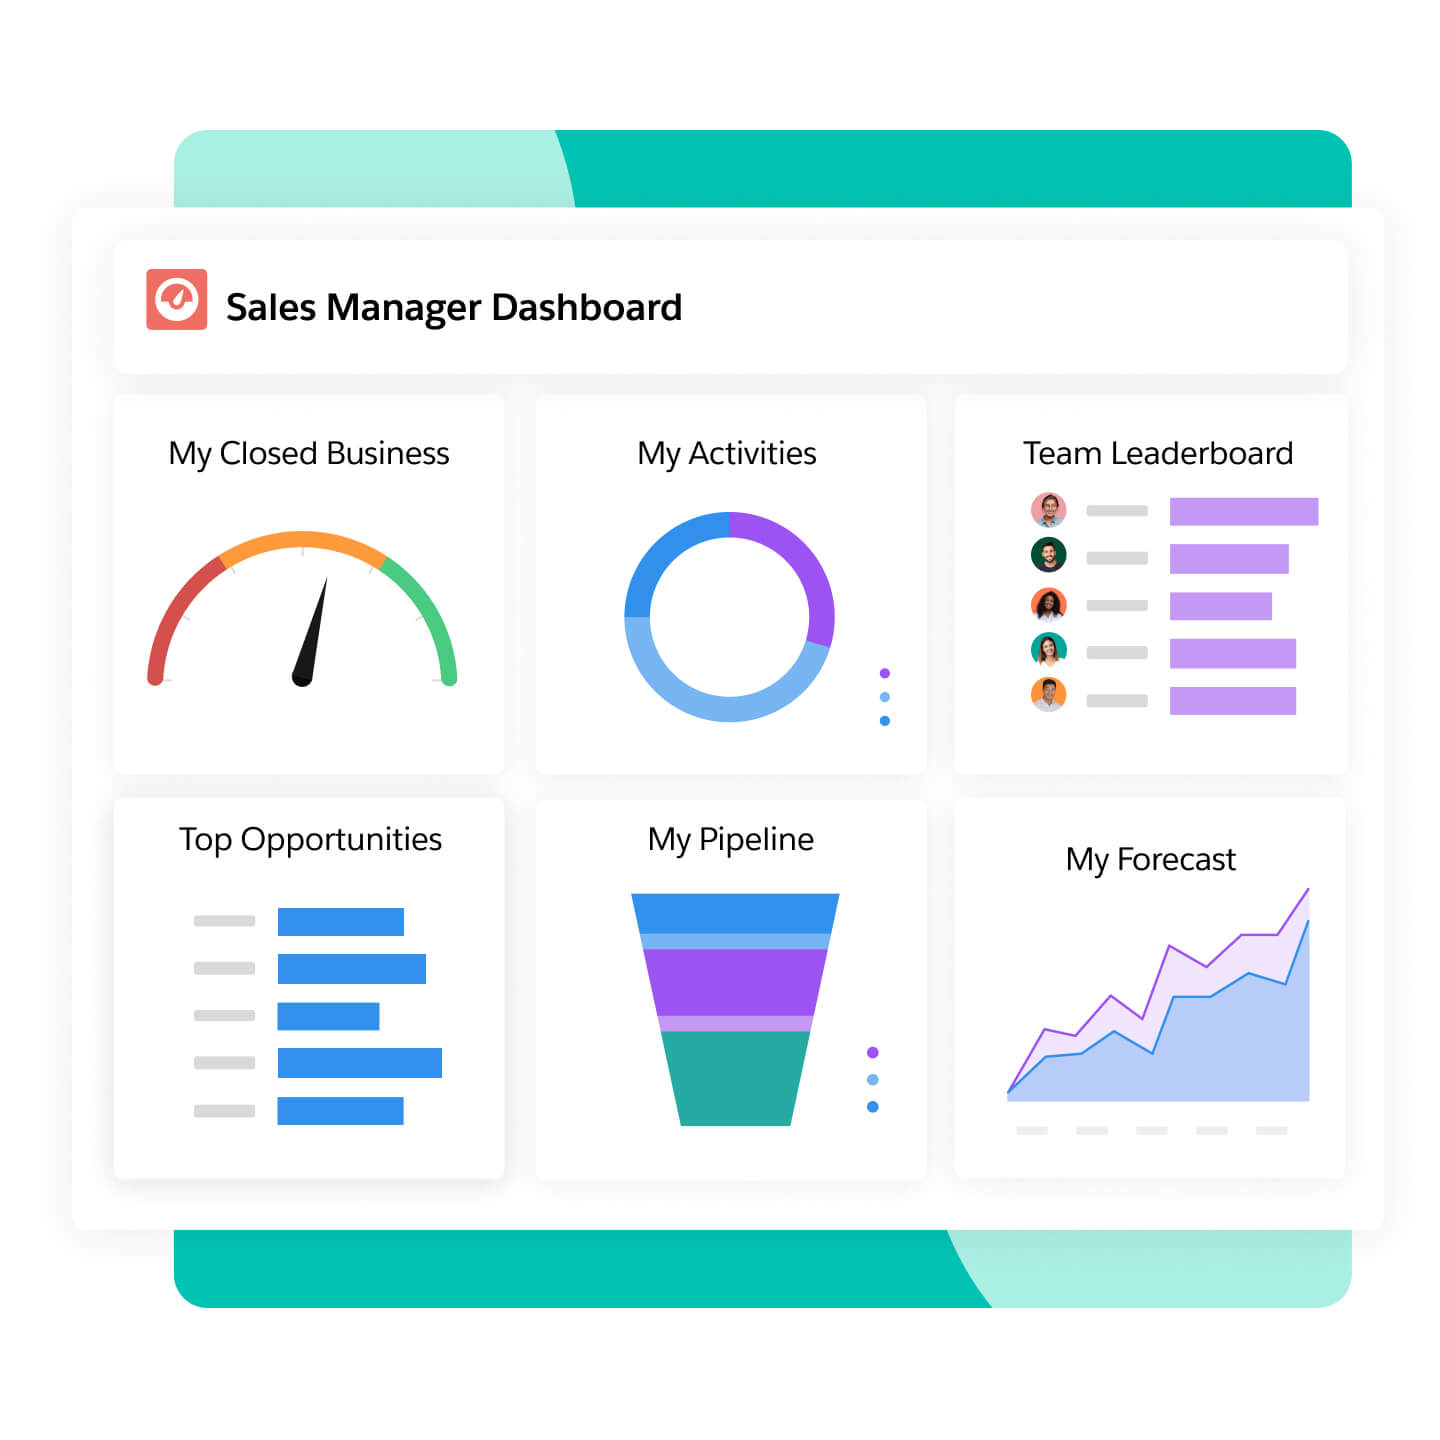
Verified: 14 Aug 2026
Open source ↗Official documentation · Close
Supports
Verified: —
Open source ↗Official documentation · Close
Supports
Verified: —
Open source ↗Official documentation · Copper
Supports
Verified: —
Open source ↗Official documentation · Copper
Supports
Verified: —
Open source ↗Official documentation · Creatio
Supports
Verified: —
Open source ↗Official documentation · Creatio
Supports
Verified: —
Open source ↗Official documentation · Dynamics 365
Supports
Verified: —
Open source ↗Official documentation · Dynamics 365
Supports
Verified: —
Open source ↗Official documentation · HubSpot
Supports
Verified: —
Open source ↗Official documentation · HubSpot
Supports
Verified: —
Open source ↗Official documentation · HubSpot
Supports
Verified: —
Open source ↗
Official documentation · monday sales CRM
Supports
Verified: —
Open source ↗Official documentation · monday sales CRM
Supports
Verified: —
Open source ↗
Official documentation · Nutshell
Supports
Verified: —
Open source ↗Official documentation · Nutshell
Supports
Verified: —
Open source ↗
Official documentation · Oracle CX
Supports
Verified: —
Open source ↗Official documentation · Oracle CX
Supports
Verified: —
Open source ↗Official documentation · Pipedrive
Supports
Verified: —
Open source ↗Official documentation · Pipedrive
Supports
Verified: —
Open source ↗Official documentation · Pipedrive
Supports
Verified: —
Open source ↗Official documentation · Salesforce
Supports
Verified: —
Open source ↗Official documentation · Salesforce
Supports
Verified: —
Open source ↗Official documentation · Salesforce
Supports
Verified: —
Open source ↗